

Housing markets with falling home prices just hit highest level since 2012
Want more housing market stories from Lance Lambert’s ResiClub in your inbox? Subscribe to the ResiClub newsletter.
Over the past year the supply-demand equilibrium—measured by shifts and levels in active housing inventory and months of supply—has shifted directionally in favor of homebuyers. That doesn’t mean buyers have all the leverage, or that the picture is the same in every market. Directionally, however, homebuyers in most markets have gained leverage compared to the 2024 housing market.
Among the nation’s 200 largest metro-area housing markets:
- 62% saw home prices rise year over year from July 2024 to July 2025
- 38% saw home prices fall year over year from July 2024 to July 2025
That’s the highest share of housing markets with falling year-over-year home prices since October 2012—when the housing market was starting to rebound following the 2007-2011 housing market crash.
Most housing markets are still seeing rising home prices on a year-over-year basis; however, the share of markets with falling year-over-year home prices is ticking up.
Using forward-looking data, ResiClub expects that the share of housing markets with falling year-over-year home prices could rise a bit more in the coming months. For evidence, just look at the seasonally adjusted month-over-month data.
Click here to view an interactive version of the chart below.
Seasonally, home prices in most housing markets experience the most upward pressure between February and July, and the most downward pressure between September and January. To remove the seasonal noise and better observe the real trend, it’s helpful to look at seasonally adjusted month-over-month home price changes.
Among the nation’s 200 largest metro-area housing markets:
- 44.5% saw seasonally adjusted home prices rise month over month from June to July 2025
- 55.5% saw seasonally adjusted home prices fall month over month from June to July 2025
Without seasonal adjustment, U.S. home prices rose 0.3% month over month from June to July 2025—a seasonal window that has averaged a 0.9% month-over-month increase since 2000. When seasonally adjusting the month-over-month change from June to July 2025, U.S. home prices fell 0.1% month over month.
Click here to view an interactive version of the chart below.
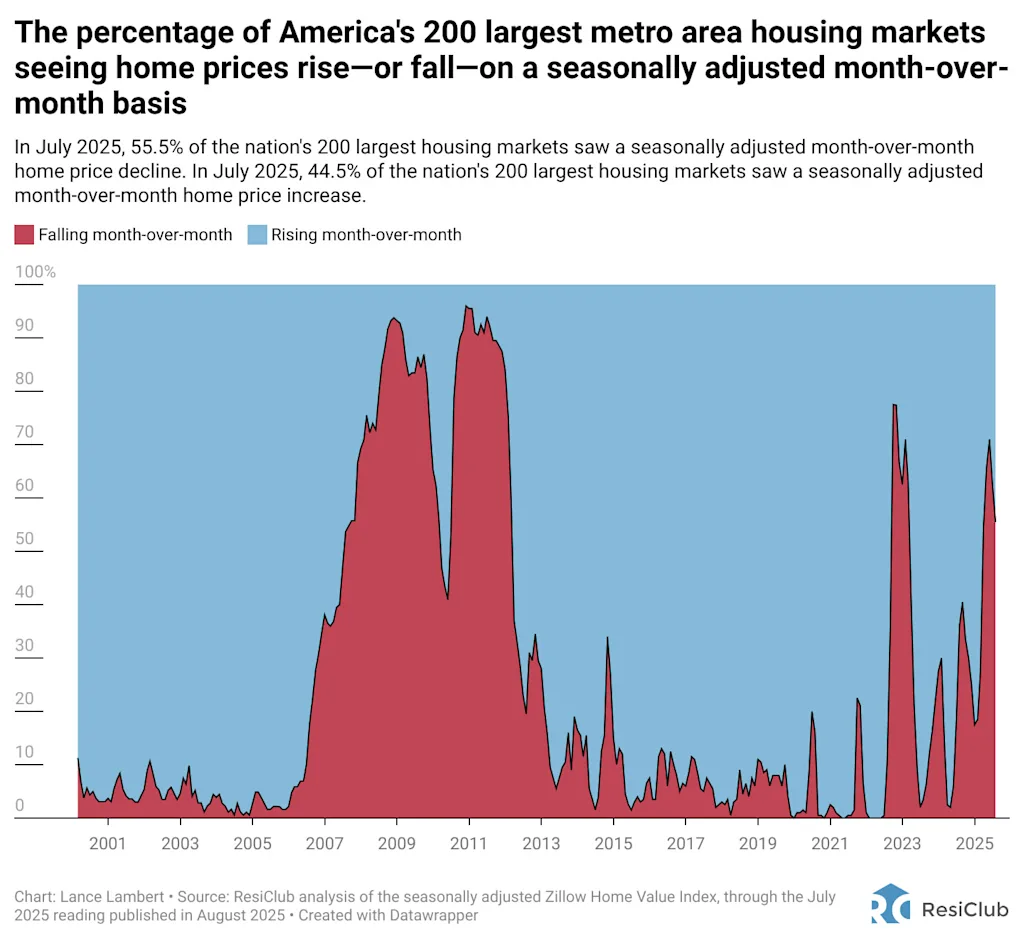
We should point out that the 2025 burst of housing market softening has lost some momentum in recent months: From April to May 2025, 71% of the nation’s 200 largest metro areas saw a month-over-month, seasonally adjusted home price decline. From June to July 2025, that share was 55%.
Originally published by fastcompany.com. Syndicated material does not necessarily reflect the views of Grazia British.
More Culture

Don’t Pull Out of Germany
Merz’s stupidity is no excuse for a stupid response. Source link

Step inside the gorgeous, futuristic offices of Vast, the startup designing the next-gen space station
A tall baobab tree greets people inside the Long Beach, California, headquarters of Vast, an aerospace company that is building the space station of the future. It’s planted beneath a…

5 ways high-performing teams stay calm when everything’s on fire
When markets swing, plans break, inboxes explode, and everyone starts saying the situation is “unprecedented” again, most teams do what humans have always done under pressure: they grip…

Confused Trump Openly Admits Plot to Rig Midterms as Polls Turn Brutal
Last week, the Supreme Court gutted protections against racial gerrymandering, and Donald Trump is already urging Republicans to seize on it. Trump unleashed a Truth Social rant on Monday…